What It Does
VizGPT is an AI-powered data visualization and analytics platform that turns raw data into interactive charts, dashboards, and insights in minutes.
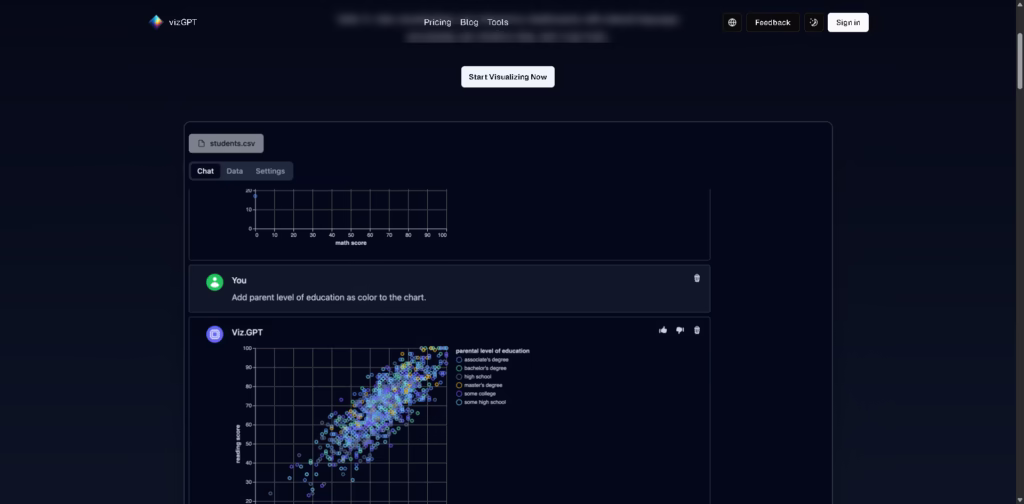
Using natural language commands and an intuitive drag-and-drop interface, it allows teams to analyze, visualize, and share data without coding.
Key Features
- Natural Language Interaction – Ask questions in plain English and get visualizations instantly.
- Drag-and-Drop Interface – Easily create charts and dashboards without any technical skills.
- Real-Time Responses – Get immediate answers and updates for your queries.
- Contextual Memory – AI remembers previous queries for a cohesive analysis workflow.
- Data Transformation & Profiling – Prepare, clean, and profile datasets for accurate visualizations.
- Collaborative Analytics – Share dashboards, invite teammates, and work together on insights.
- AI-Powered Chart Generation – Quickly generate bar, line, scatter, pie, and bubble charts from your data.
Who Is VizGPT For?
- Business Teams – Quickly create reports and dashboards to monitor KPIs and trends.
- Data Analysts – Transform and visualize data faster with AI assistance.
- Educators & Researchers – Present data findings in an interactive and intuitive way.
- Startups & Enterprises – Enable cross-team collaboration with centralized, easy-to-understand insights.
- Non-technical Users – Turn complex datasets into clear, actionable visuals without coding.
Final Thoughts
VizGPT brings the power of AI to data visualization, making analysis faster, simpler, and more collaborative. It’s perfect for anyone who wants to turn raw data into compelling insights without learning complicated tools.
Start a free trial today and see your data tell its story in minutes.


