What It Does
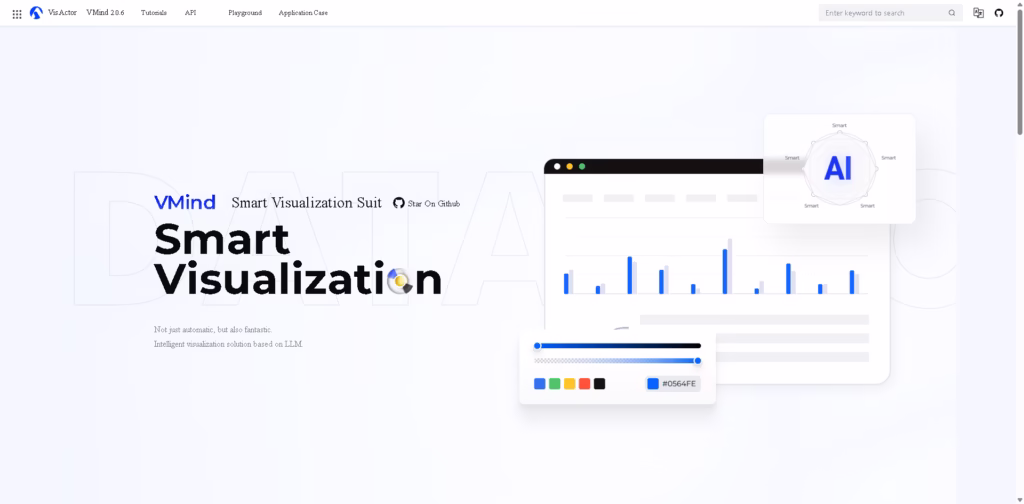
VMind is an AI-powered tool that instantly turns your raw data into clear, interactive, and visually appealing graphs.
From bar charts and line graphs to flow diagrams and mind maps, it automates the creation process while suggesting the best style, colors, and layout for your data.
Perfect for anyone looking to visualize insights quickly and beautifully.
Key Features
- Intelligent Visualization – Uses AI to automatically suggest the best chart types and layouts.
- Smart Color Matching – Chooses visually appealing palettes that make data easy to interpret.
- Code Generation – Automatically generates code for embedding or custom visualizations.
- Multi-Platform Support – Integrates with platforms like Volcano Engine, Lark, TikTok, and CapCut.
- LLM-Powered Recommendations – Suggests insights and visual enhancements based on your dataset.
- User-Friendly Interface – Designed for beginners and professionals alike, no advanced coding needed.
Who Is VMind For?
- Data Analysts – Quickly turn datasets into visually appealing charts and dashboards.
- Marketing Professionals – Create shareable, insightful visuals for campaigns and reports.
- Educators & Students – Simplify teaching or presenting complex datasets with clear visuals.
- Developers & Tech Teams – Leverage generated code to integrate visualizations into apps or websites.
- Business Teams – Gain faster insights from business intelligence data without design expertise.
Final Thoughts
VMind combines AI intelligence with a sleek interface to make data visualization fast, simple, and professional-looking.
Whether you’re presenting insights, teaching, or integrating visuals into apps, VMind can save time and enhance your data storytelling.
Start transforming your data into smart, beautiful visualizations today!


