What It Does
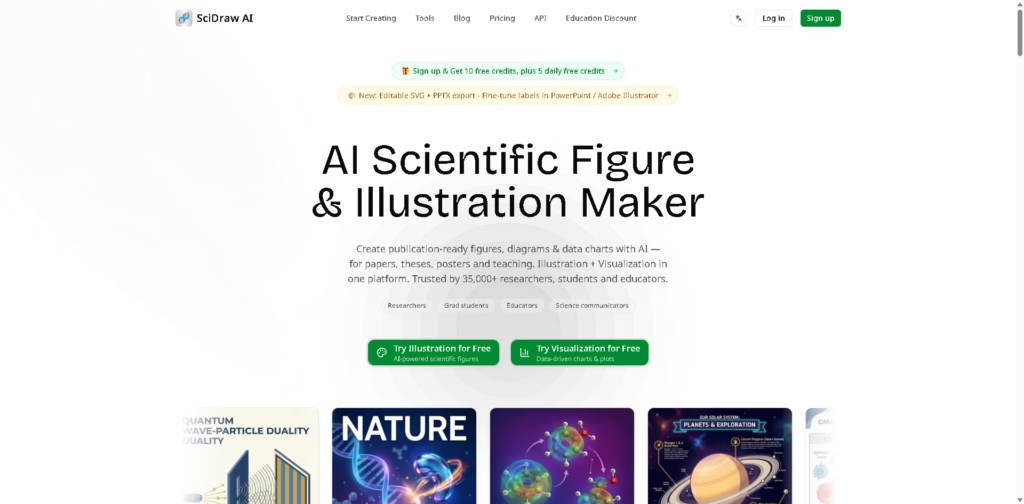
SciDraw AI is an AI-powered scientific illustration platform designed to help researchers, students, educators, and science communicators create publication-ready figures without traditional design software. It combines AI-generated scientific illustrations with data visualization tools in a single platform.
Instead of manually building diagrams in PowerPoint or Illustrator, users can describe a concept, upload a sketch, or import CSV/Excel data to generate figures, charts, graphical abstracts, and teaching visuals. A typical workflow is describing a biological pathway, refining the generated illustration through AI edits, exporting it as an editable SVG or PPTX, and making final label adjustments before submitting a paper.
At a Glance
| Field | Details |
|---|---|
| Category | Scientific illustration & visualization |
| Platforms | Web |
| AI Features | Text-to-image, sketch editing, data visualization |
| Export Formats | SVG, PPTX, PNG, PDF, EPS, TIFF |
| Free Plan | Yes |
| API | Yes |
| Primary Strength | Editable scientific figures for research and teaching |
Key Features
- Generate scientific illustrations from text descriptions.
- Convert sketches into polished research figures.
- Create publication-ready charts from CSV and Excel data.
- Export editable SVG and PPTX files.
- Apply journal-inspired formatting presets.
- Support colorblind-friendly chart palettes.
Best For
- Creating graphical abstracts for research papers.
- Designing labeled teaching diagrams.
- Converting hand-drawn research sketches into polished visuals.
- Producing publication-ready charts from research datasets.
- Building consistent figures across these and presentations.
Pros & Cons
| Pros | Cons |
|---|---|
| Editable SVG and PowerPoint exports | Credit-based pricing may not suit heavy occasional users |
| Combines illustrations and charts in one platform | Some advanced exports require paid plans |
| Free plan includes daily credits | Journal-style presets may still require manual refinement |
| Supports multiple scientific diagram workflows | Best suited for scientific content rather than general design |
Alternatives & Comparisons
| Alternative | Best For | Key Difference |
|---|---|---|
| BioRender | Biology illustrations | Larger biomedical icon library |
| Adobe Illustrator | Professional vector editing | Manual design instead of AI generation |
| Canva | General presentations | Not specialized for scientific figures |
| Microsoft PowerPoint | Basic diagrams | Simpler editing with fewer research-focused features |
SciDraw AI sits between specialized scientific illustration tools and traditional design software. It is most compelling for users who want AI-assisted figure creation with editable exports rather than building diagrams from scratch.
Frequently Asked Questions
Is SciDraw AI free?
Yes. It offers a free plan with signup credits and recurring daily credits.
Can I edit generated figures after exporting?
Yes. SVG exports work with vector editors, and PPTX exports allow label editing in PowerPoint.
Can SciDraw AI create charts from research data?
Yes. It can generate publication-ready charts from CSV and Excel files.
Does SciDraw AI support journal-style figures?
Yes. It includes formatting presets inspired by major scientific journals.
Is there an API?
Yes. The platform provides developer API access.
Overall Rating
| Category | Score |
|---|---|
| Performance | 9.4/10 |
| Ease of Use | 9.2/10 |
| Feature Set | 9.6/10 |
| Workflow Fit | 9.5/10 |
| Overall | 9.4/10 |
SciDraw AI offers a well-rounded workflow for creating research figures, especially when editable exports and AI-assisted illustration matter more than manual vector design.
Final Verdict
- Best for: Researchers creating publication-ready figures without advanced design skills.
- Avoid if: You only need occasional basic diagrams for presentations.
- Biggest strength: AI-generated scientific figures with editable SVG and PowerPoint exports.
- Best alternative: BioRender for biology-focused illustration workflows.