What It Does
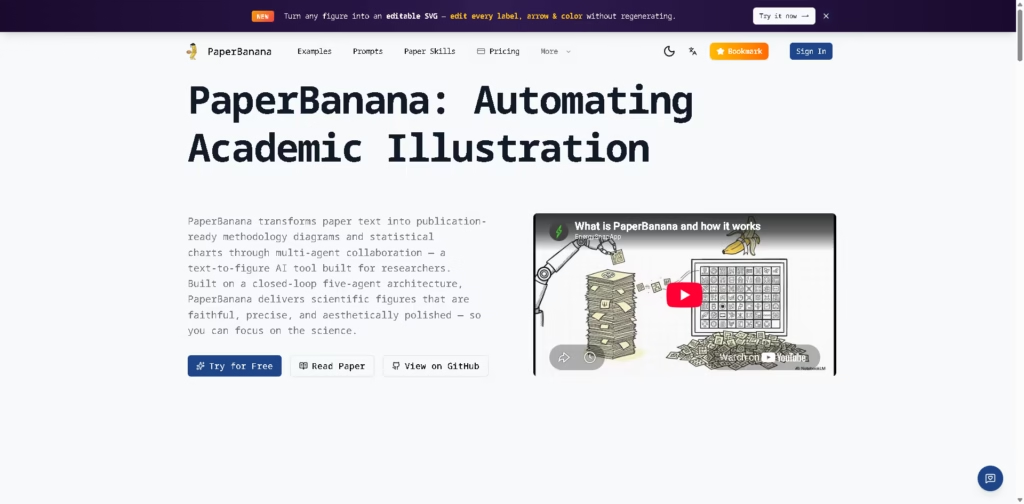
PaperBanana is an AI-powered academic illustration platform that converts research text into publication-ready figures, methodology diagrams, and statistically accurate charts. Unlike general image generators, it uses a multi-agent workflow that separates planning, visualization, and refinement to produce figures intended for research papers, theses, posters, and presentations.
The platform is designed for researchers, graduate students, and educators who spend significant time creating scientific visuals. A typical workflow is pasting a methodology description, generating a conference-style diagram, refining it with AI, exporting an editable SVG, and making final label adjustments before submission.
At a Glance
| Field | Details |
|---|---|
| Category | AI academic illustration |
| Platform | Web |
| AI Workflow | Multi-agent figure generation |
| Export Formats | SVG, JPG |
| Free Trial | Yes |
| Open Source | Research framework available on GitHub |
| Primary Strength | Research-focused methodology diagrams and accurate statistical charts |
Key Features
- Generate methodology diagrams from natural language.
- Create statistical charts using executable Matplotlib code.
- Convert existing figures into editable SVG files.
- Refine hand-drawn sketches into polished illustrations.
- Apply conference-style visual refinement automatically.
- Upload papers for automatic style retrieval on higher plans.
Best For
- Creating methodology diagrams for conference papers.
- Generating statistically accurate research charts.
- Refining rough sketches into publication-quality figures.
- Producing educational scientific infographics.
- Building consistent visuals across research papers and posters.
Pros & Cons
| Pros | Cons |
|---|---|
| Research-specific diagram generation | Credit-based pricing for image generation |
| Editable SVG exports preserve labels and arrows | Some advanced features require paid plans |
| Statistical charts prioritize numerical accuracy | Web-based workflow may not suit offline-only users |
| Supports figure refinement from existing sketches | Strongest value centers on academic use cases |
Alternatives & Comparisons
| Alternative | Best For | Key Difference |
|---|---|---|
| BioRender | Biology illustrations | Larger biomedical asset library |
| SciDraw AI | Scientific figures and charts | Broader illustration and teaching workflow |
| Adobe Illustrator | Manual vector editing | Professional editing without AI generation |
| Canva | General presentations | Not specialized for academic figures |
PaperBanana occupies a niche between scientific illustration platforms and general AI image generators. It is most suitable when users need publication-oriented methodology diagrams and mathematically reliable statistical plots rather than decorative graphics.
Frequently Asked Questions
Can PaperBanana generate methodology diagrams from text?
Yes. It converts natural language descriptions into structured academic diagrams.
How are statistical charts different from normal AI-generated charts?
Charts are generated through executable Python Matplotlib code instead of image-only rendering.
Can I edit generated figures afterward?
Yes. PaperBanana can export figures as editable SVG files with editable labels, arrows, and colors.
Is PaperBanana open source?
The underlying research framework is available on GitHub alongside its research paper.
Can PaperBanana improve hand-drawn diagrams?
Yes. It can refine sketches while preserving their original scientific structure.
Overall Rating
| Category | Score |
|---|---|
| Performance | 9.5/10 |
| Ease of Use | 9.2/10 |
| Feature Set | 9.4/10 |
| Workflow Fit | 9.6/10 |
| Overall | 9.4/10 |
PaperBanana stands out by focusing on research-specific figure generation, especially for methodology diagrams and statistically accurate visualizations that require minimal manual cleanup.
Final Verdict
- Best for: Researchers creating publication-ready methodology diagrams and statistical figures.
- Avoid if: You only need general-purpose graphic design or presentation visuals.
- Biggest strength: Multi-agent AI workflow with editable SVG exports and accurate chart generation.
- Best alternative: SciDraw AI for broader scientific illustration and teaching workflows.