What It Does
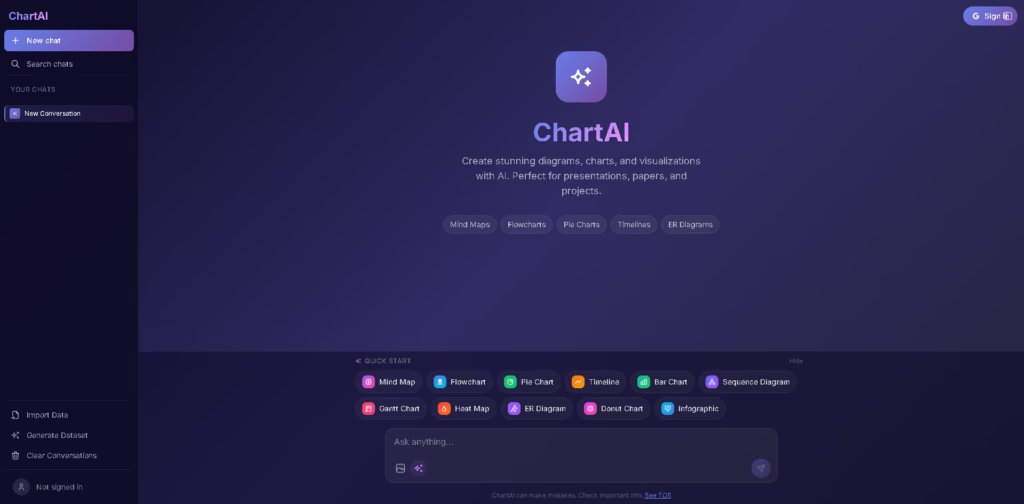
ChartAI is an AI-powered tool that transforms your raw data and ideas into professional, visually appealing charts, graphs, and diagrams.
From mind maps and flowcharts to pie charts and timelines, it makes complex data simple and presentation-ready. Whether you’re preparing a report, a project, or a presentation, ChartAI brings your visuals to life in just a few clicks.
Key Features
- Mind Maps & Flowcharts – Easily create structured diagrams to visualize processes, ideas, or projects.
- Pie, Bar, and Donut Charts – Generate standard charts instantly from your data for clear insights.
- Timelines & Gantt Charts – Display events or project schedules with visually appealing timelines.
- ER & Sequence Diagrams – Perfect for technical documentation, software design, or data modeling.
- Infographics – Turn raw data into engaging, presentation-ready visuals.
- AI Assistance – Natural language input lets you describe what you need and instantly generate charts.
- Quick Customization – Adjust colors, labels, and layout without coding.
Who Is ChartAI For?
- Students & Educators – Create visual aids for projects, papers, and presentations.
- Business Professionals – Make reports, dashboards, and workflow diagrams quickly.
- Data Analysts – Turn raw data into readable, professional charts without design software.
- Project Managers – Plan and visualize timelines, tasks, and team workflows.
- Developers & Designers – Quickly generate ER diagrams, flowcharts, or sequence diagrams for documentation.
Final Thoughts
ChartAI is a powerful yet user-friendly tool for anyone who needs clear, engaging visualizations without spending hours in design software.
Its AI-driven approach saves time and makes your charts look polished and professional. Whether for education, business, or personal projects, ChartAI is a reliable choice to turn ideas and data into impactful visuals.
Try it today and see how effortlessly your data comes to life.


